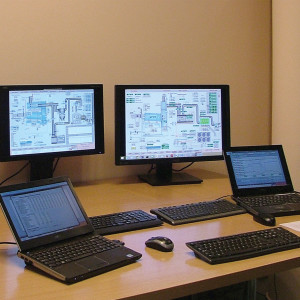
Visual representation systems allow monitoring of operation parameters of a system and their presentation in a readable graphical form. The system provides visualisation of change tendencies of measured values and their storage, which makes event evaluation and operation of complicated systems easier for operating personnel. Automatic reporting of failures and their registration is also provided. The visual representation software includes report generation functions which register operation parameters. Measurement is done using reference methods specified in Appendix 6 of the Regulation of the Minister of Environment of 4 November 2008 on requirements with regard to measuring emission volumes and measuring the quantity of collected water. Data collected from measuring devices is registered and used as a basis for creation of daily, monthly, quarterly, semi-annual and annual reports.
An example of software we develop is a monitoring system for current parameters of waste disposal units. We can measure levels of the following ingredients of flue gas at the same time: SO2, CO, NOx, HCl, HF, O2, TOC, total ash content, and temperature, static pressure as well as flue gas flow speed. Gas contamination analysers and sample preparation unit are locked in a ventilated measurement cabinet. System operation is controlled by a PLC controller. The controller sends signals to a server, also functioning as an emission-monitoring computer processing, visualising and reporting the measured values to environment protection authorities. The systems manufactured by our company have been fully approved by environment protection authorities.
